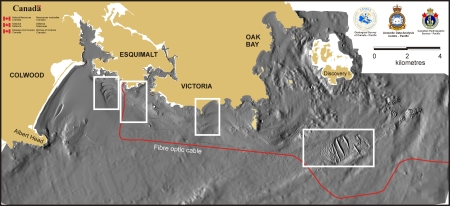
The morphology of the seafloor surrounding Victoria is a result of a combination of bedrock topography, glacial erosion and deposition during the last ice age, sea level change since deglaciation and human interference. The image above has been generated by creating a digital terrain model from high resolution multibeam and single beam sonar bathymetry data. Artificial sun-illumination is from the west. The seafloor geology consists of silty-clay in Esquimalt and Victoria Harbour, with sand and silt further offshore; and a gravel surface lag most everywhere else. Below the surficial gravel, however, is till and silty-clay deposited by melting glaciers. Bedrock outcrop can be seen where the seafloor texture appears rough, such as at Brotchie Rock or at the mouth of Haro Strait, southeast of Discovery Island.
The region sustains heavy use by humans. Commercial and recreational shipping make substantial use of Esquimalt and Victoria Harbours. The Canadian Pacific Coast Guard Fleet is housed at Ogden Point, and Esquimalt is home to the Canadian Pacific naval fleet. The harbours also support ship building, fishing and logging industries. Signs of significant dredging within the harbours can be seen on this seafloor morphology map, to provide deep-water for large-draft vessels. The water front also has undergone significant modification through engineering attempts at shoreline protection. The Victoria water front is the location for two of the Capital Regional District sewage outfall pipes: Macauley Point and Clover Point. Other seafloor installations include a fibre-optic cable laid in 1999.
Multibeam surveying of the region has uncovered some features considered unique and extremely valuable scientifically.
Sea Level
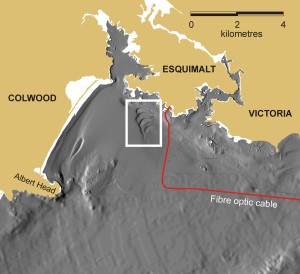
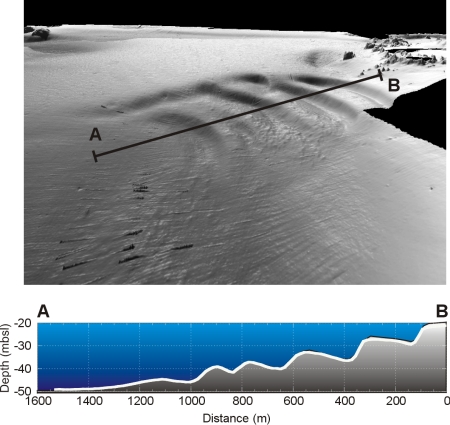
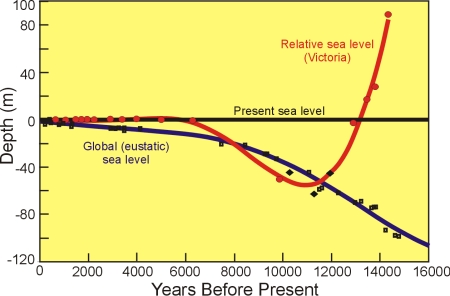
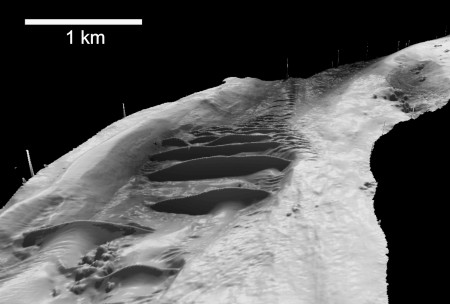
Computer manipulation of high resolution digital terrain models allow us to look at features from a variety of perspective views. Below is an image looking southwest, across a series of 6 steps or terraces. These terraces are believed to be the result of a lowering of sea level following the disappearance of glaciers from the region, between about 14,500 and 9,000 years ago. The region was depressed under the substantial weight of ice during the last ice age. Relative sea level was high, up to 90 m above present, as a result. As the ice melted, the load was removed and the land rebounded, causing relative sea level to fall. Features such as these terraces allow us to calculate the amount of sea level fall. The lowest terrace dates between 9,000 and 10,000 years ago, so we know sea level was about 50 m lower than present at that time. Information about sea level curves are critical to understanding the impact of possible sea level change on a given region.
Esquimalt Harbour
Image of terraces
Sea level graph
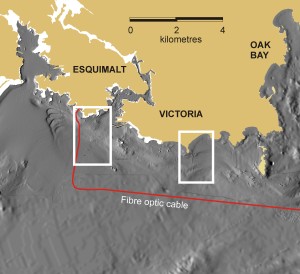
Sewage Outfall
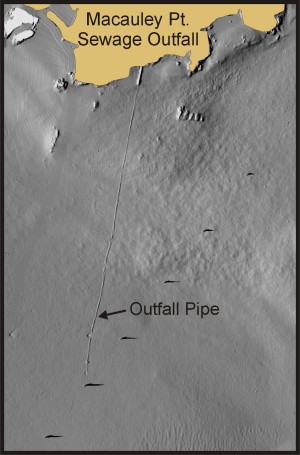
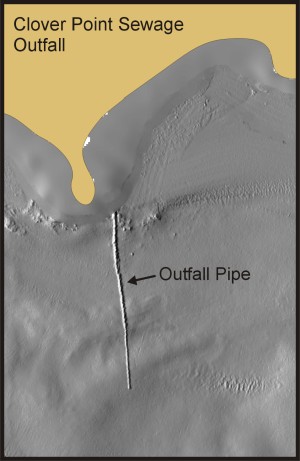
Two outfall pipes disperse most of the sewage and waste water from the Victoria Capital Regional District. These pipes extend along the seafloor from Macauley Point and Clover Point (below). The Macauley Point outfall dispenses about 50,000 m3 per day and the Clover Point outfall about 70,000 m3 per day.
Seafloor map
Location of Sewage Outfall
Location of outfall pipe
Despite these quantities, little evidence of this material remains in the vicinity. Strong tidal and estuarine circulation in the Juan de Fuca Strait, involving currents in excess of 1 metre per second, flush the waters of the strait daily.
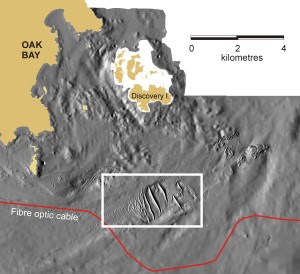
Sand Dunes
The submarine sand dunes imaged in this location are among the largest in the world yet identified. They are up to 25 m high, 300 m long, 1200 m wide and contain 26 million cubic metres of coarse sand and fine gravel. They are formed in much the same way as current ripples, requiring strong currents (> 2.5 km/hour) to construct them. Ocean currents in eastern Juan de Fuca Strait consist of tidal and estuarine components. Tidal currents are principally a combination of diurnal (1 cycle per 25 hours) and semi-diurnal (2 cycles per 25 hours) constituents, resulting in two ebb and two flood currents each day with unequal speeds. Superimposed on the rapidly varying tidal currents are more persistent estuarine currents driven by the hydraulic head of the Fraser River as it enters the Strait of Georgia near Vancouver. Combined bottom currents off Victoria can readily exceed 3.6 km/hr during each tidal cycle, sufficient enough to erode and transport the sand and gravel that comprise the sand dunes.